Which California ag parcels are most exposed to SGMA water restrictions?
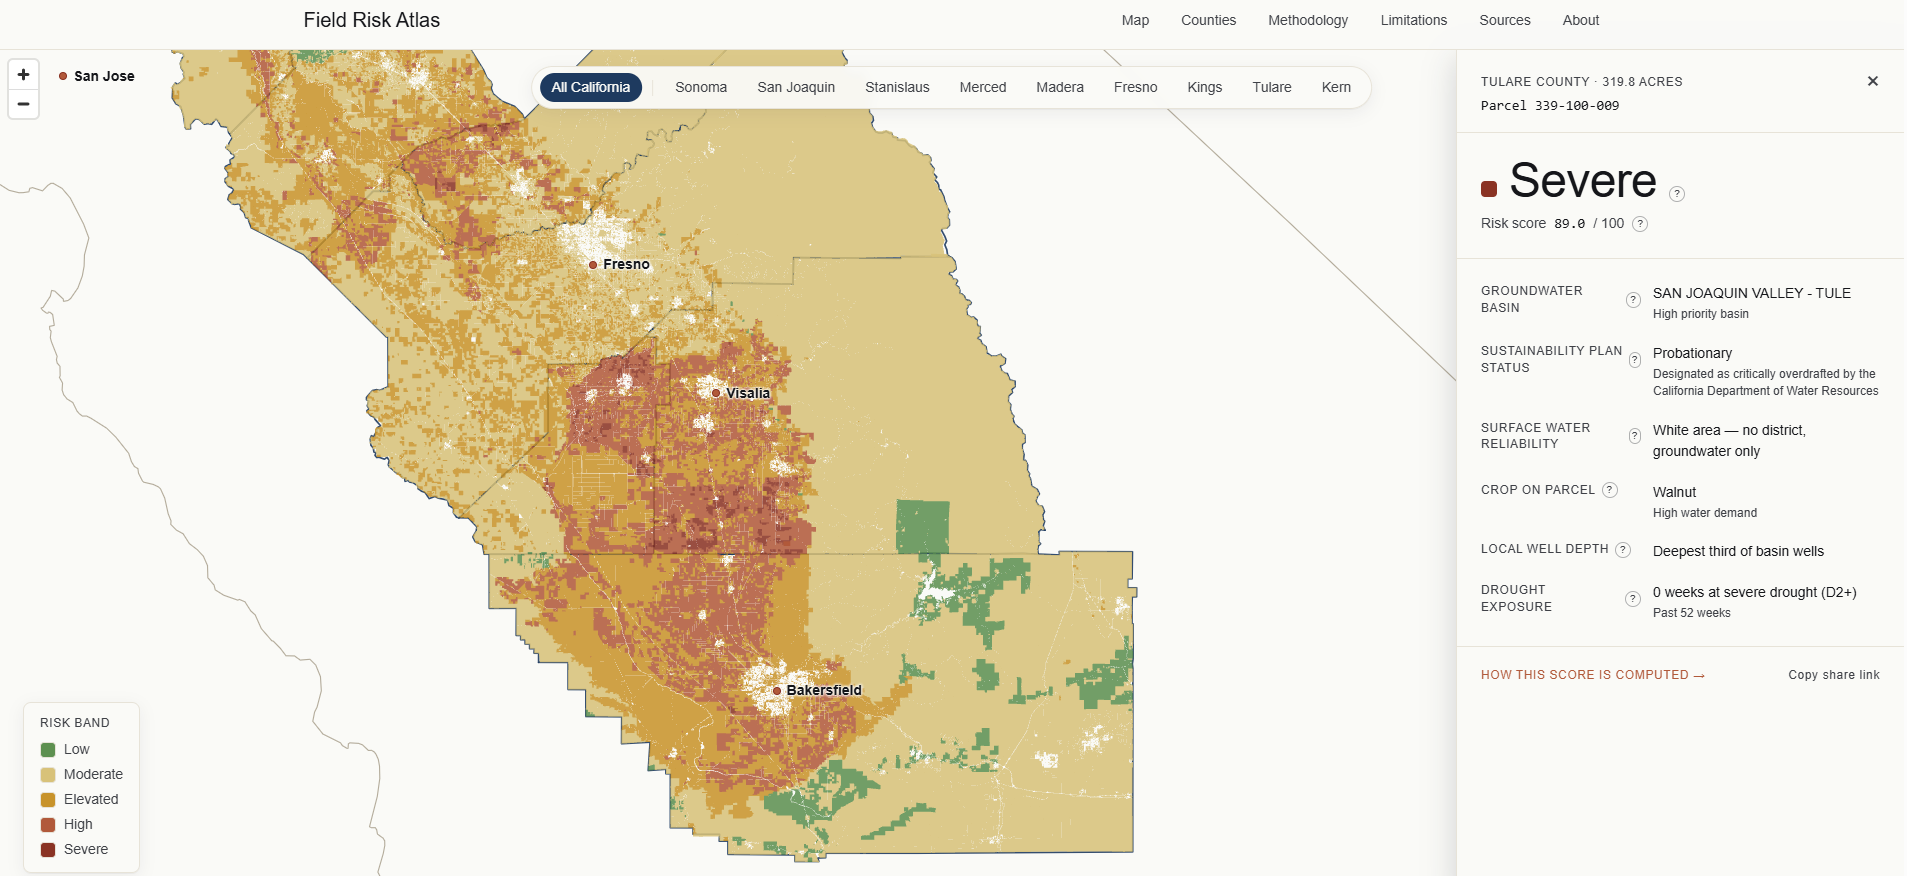
The Field Risk Atlas is an interactive parcel-level map that scores every farmable parcel in nine California counties — the San Joaquin Valley plus Sonoma — on water risk under the Sustainable Groundwater Management Act. Each parcel gets a 0–100 score and a five-band classification built from public DWR, USDA, U.S. Drought Monitor, and ASFMRA data. Search by APN to pull up a specific parcel, or pan the map. Free, open-methodology, parcel-level.
How the water-risk score is calculated
Each parcel's 0–100 score combines five inputs:
- SGMA basin status. DWR's basin prioritization and the status of the subbasin's Groundwater Sustainability Plan — critical overdraft basins with weak or unapproved GSPs score worst.
- Water-district reliability. The parcel's surface-water-district allocation history. Districts with deep historical cutbacks lean more heavily on groundwater, which raises SGMA exposure.
- Dominant crop class. Perennial high-water crops (tree nuts, vines) cannot be fallowed in a dry year the way annuals can, so they carry higher risk in stressed basins.
- Local well depth. A proxy for aquifer health and pumping cost. Deeper wells in the area signal more drawdown and higher operating cost going forward.
- Drought exposure. Recent U.S. Drought Monitor history at the parcel's county, which acts as a near-term stressor on top of the structural SGMA picture.
Inputs are normalized to a common 0–100 scale, weighted, and summed into the final parcel score. The result is binned into five bands so a non-specialist can read the map without needing to interpret the underlying weights:
| Severe | 80–100 | Worst-case stack — critical-overdraft basin, perennial high-water crop, weak water-district tier, drought. |
| High | 60–80 | Multiple risk factors aligned. Active SGMA constraints expected. |
| Moderate | 40–60 | One or two material stressors. Worth monitoring across SGMA implementation milestones. |
| Watch | 20–40 | Some risk in the stack but largely insulated by surface-water reliability or basin status. |
| Low | 0–20 | Healthy basin, reliable district, low-water crop, shallow stable wells. |
Data sources
Every input is public and freely available:
| Source | What it provides | Cadence |
|---|---|---|
| California DWR | SGMA basin prioritization, GSP status, subbasin boundaries, well-depth data | Multi-year review cycle |
| USDA | Crop class and farmable-land coverage at the parcel level | Annual |
| U.S. Drought Monitor | County-level drought severity history | Weekly |
| ASFMRA | Land-use and ag-land reference data informing classification | Periodic |
Why parcel-level matters for SGMA
SGMA is implemented at the subbasin level, but the conditions that determine risk sit at the parcel level. Two parcels in the same subbasin can look very different depending on the water district that serves them, the crop they grow, and the depth of nearby wells. A basin-level map averages those differences away. The Field Risk Atlas keeps them.
The cover is the nine counties that together contain most of California's SGMA-exposed perennial acreage: San Joaquin, Stanislaus, Merced, Madera, Fresno, Kings, Tulare, Kern across the San Joaquin Valley, plus Sonoma. That's roughly 375,000 farmable parcels, every one of them scored.
The full methodology is documented at sgma.mcmillinanalytics.com/methodology.
Frequently asked questions
What is SGMA?
SGMA is California's Sustainable Groundwater Management Act, passed in 2014. It requires local agencies in high- and medium-priority groundwater subbasins to adopt Groundwater Sustainability Plans (GSPs) and bring those basins into long-term balance. In overdrafted basins, that almost always means pumping restrictions, allocation cuts, or fees on agricultural groundwater use.
Which California counties does this cover?
Nine counties: San Joaquin, Stanislaus, Merced, Madera, Fresno, Kings, Tulare, and Kern across the San Joaquin Valley, plus Sonoma. Together they contain roughly 375,000 farmable parcels.
Can I look up a specific parcel by APN?
Yes. Every farmable parcel in the nine covered counties is indexed by its county Assessor's Parcel Number (APN). Paste an APN into the search box and the atlas zooms to that parcel and opens its full water-risk breakdown — SGMA basin status, GSP status, water-district tier, crop class, well depth, and drought exposure. You can also browse the map and click any parcel directly.
Which crops are most exposed to SGMA pumping restrictions?
Perennial, high-water crops in critical-overdraft subbasins carry the most exposure: almonds, pistachios, walnuts, and grapes. They cannot be fallowed in response to a dry year — the trees are a 25-year capital investment. Specialty vegetables and leafy greens are also exposed where they rely on heavily pumped groundwater.
What does "Severe" mean in the band classification?
Severe is the highest of the five bands and corresponds to scores of 80 and above. It typically signals a parcel where multiple stressors are stacked: a critical-overdraft subbasin, a perennial high-water crop, a low-reliability water district, and recent drought exposure.
Is the Field Risk Atlas free?
Yes. The tool is free to use with no signup, and the methodology, data sources, and scoring logic are documented openly at sgma.mcmillinanalytics.com/methodology. Every input is public.
How often does the data refresh?
The atlas ships as a snapshot, currently May 2026. SGMA inputs move on long cycles — GSPs are reviewed and amended on multi-year schedules, and water-district reliability changes year over year — so a snapshot cadence is appropriate to the underlying data. The drought-exposure input is refreshed at each snapshot release.